Polygenic Risk Score Reports
Introduction
Since ancient history humanity has been aware that an indiviudal is more likely to resemble their parents as compared to any other random individual. The mechanism for this hereditary pattern was a matter of great speculation. Eventually, through great advances in the underlying instruments and technologies, we found out that DNA records the instructions of life, and this DNA is passed on from parents to children. Several decades later, sequencing of the genome was able to locate specific locations where two different genetic identities associate with two different physical outcomes. However, for many physical outcomes, namely diseases, these genetic associations were not strong enough to be useful on their own. In other words, any single genetic association does not have enough impact on disease such that a doctor really cares about the genetic identity of their patient. A simple workaround was soon discovered, the polygenic risk score, which is the sum of the impacts brought by many single genetic associations.
In the past ten years interest in polygenic risk scores has exploded. There are many, many issues that can confound and diminish a polygenic risk score, including linkage disequilibrium, population structure and environmental interactions. Then there is also just the plain problem of properly identifying the best genetic associations that can translate into the best polygenic risk score. Despite these many problems, some relatively accurate polygenic risk scores have been generated. In theory, these polygenic risk scores can be integrated into a larger disease risk model such that doctors can identify individuals who are most vulnerable to disease, and then recommend highly effective mitigating strategies. This scenario is occuring in the real-world, with companies such as 23andMe, Ambry Genetics and Color all providing polygenic risk score reports to clinicians. My own institution wants to be on the cutting edge of advancements, so I have been tasked with making my own version of polygenic risk score reports.

Resources
Imagine a doctor, wants a polygenic risk score report. You can do the computations, but of course require some data with which to process. First is the patient’s genotype. A clinical sequencing laboratory should be able to provide the data with minimal interactions or troubles (after all many patients are sequenced for rare variant related conditions all the time). Second are the set of variants that are used to calculate the polygenic risk score. There are many possible sets of variants available on the PGS Catalog, or perhaps you have your own set of variants that has been working well in the lab. Either way, you have to decide from all the options what specific set of variants you are using in this report. In general, it is best to go with the set of variants that has been validated as most accurate in some large, trustworthy dataset. Although, it is also important to listen to the doctor, as they might have a set of variants in mind, or may only trust a set of variants with fewer than X variants included. Once the set of variants is determined, you may be able to tailor your original genotyping strategy, as perhaps only a few variants need to be sequenced or perhaps so many need to be sequenced that it would make sense to conduct imputation from chip data. These types of approaches are likely best determined through collaboration with a sequencing specialist (although maybe that is yourself).
In my situation, genotyping was conducted with whole genome sequencing so I did not have to worry about imputation. The set of variants used for calculation is still being determined.
Report Design
Data visualization is a critical skill that, in my opinion, is often undervalued in academic spaces. Just go to a typical seminar where powerpoint slides are often going to conain a figure taken directly from a paper, with minimal adjustments for the different medium. In the context of polygenic risk score reports, I understand good data visualization to mean that the necessary information must be displayed in the clearest and most engaging format as possible. Unfortunately, there are few examples of other polygenic risk score reports, and current recommendations for report presentation are a little vague and do not always apply to the context I am working within. Therefore, it should be somewhat obvious that the current report I will present and explain is preliminary, and is in the process of undergoing rapid changes and improvements through consultation with relevant clinicians.
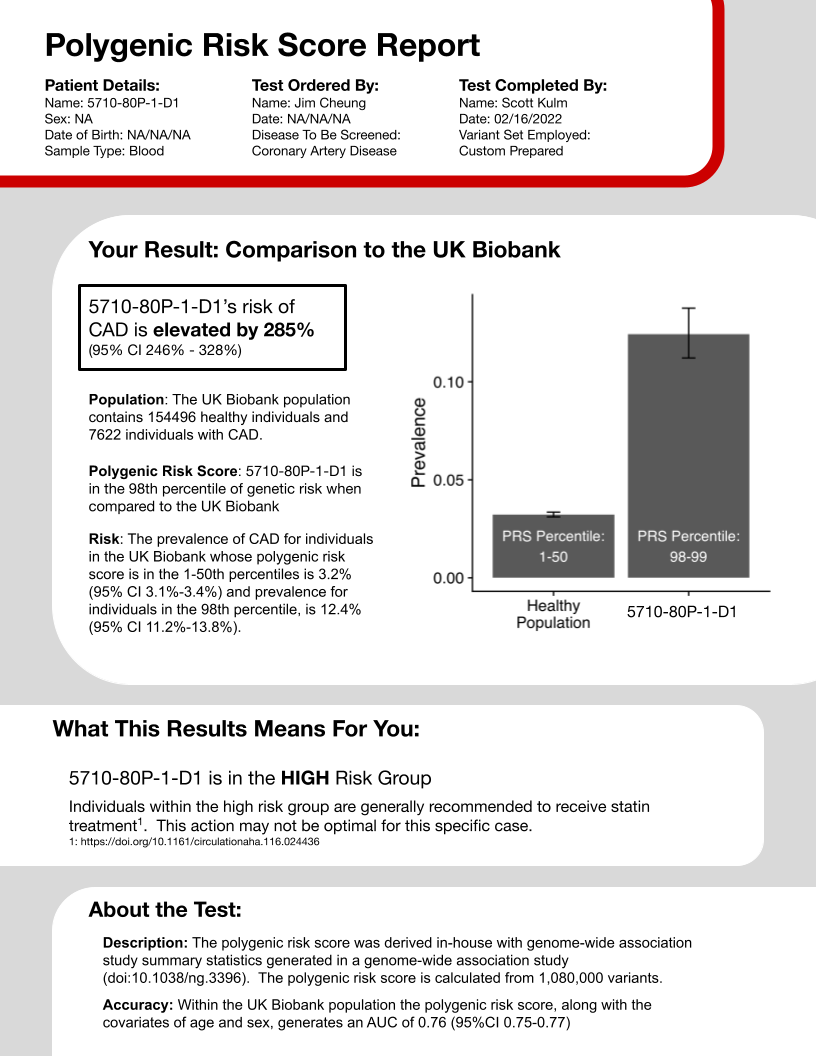
The first section is the basic information: patient name, birth date, the ordering clincian, disease of interest, the set of variants, and current date. While a few of these entries could be altered, I imagine that most of it should be reatined no matter the report created.
The second section is the key, and likely most desired information, the genetic risk of the patient. However, there are two big considerations you have to make when constructing this section. First, what statistic should represent risk? Lifetime absolute risk is a popular option, although one that requires some difficult calculations with many choices and parameteres. Odds ratios, relative risk and prevalence are just a few of the options that can depict how one person’s chance for disease differ from another set of people. After consulting with a primary clincian involved with this project, I decided to go with prevalence as it is immediately interpretable, not requiring any thoughts relating the risk score to some other statistic. Second, what population is being compared to? In other words, the polygenic risk score of the individual in the report must be determined as high or low by comparing it to a group of scores for other individuals, who are these other individuals. In my polygenic risk score report I used the UK Biobank. This selection is advantageous because it is a large, well-repsected dataset, but also disadvantageous because its individuals are genotyped using different techologies and it has been utilized in the derivation of many other polygenic risk scores, preventing use in this situation (because of overfitting).
The third section translates the risk reported in the previous section into a recommendation that has been shown to help other individuals in similar risk situations. I will admit this section, as compared to any other, likely requires the most development. Careful rules need to be drawn that convert risk percentiles into risk categorizations, and then each category must be related to some action - whether that is nothing at all or serious surgery.
Thr fourth and final section describes the polygenic risk score itself, not the specific patient. I think of this section as the fine print that medications ads must include for legal reasons. The accuracy is reported with data from the UK biobank, for the same reasons as given above in the risk statistics section. Other pieces of data could be added as the report progresses.
There are some very large areas for improvement. First, I am currently not considering the population of the individual being reported. I am actively working on changing the code such that group of individuals being compared to when calculating risk statistics matches the ancestry of the individual being reported. I am specifically doing so by using PCA clustering methods to determine the 1000 genomes defined ancestry of all relevant individuals. Second, I want to switch the population that is being used to calculate the risk statistics. Ideally, I would use the same individuals that are being enrolled at my institution. That way the sequencing technologies are the same and everyone would be from the same region. There are still likely confounding factors between individuals, but likely fewer factors than between a United Kingdom and United States populations.