Discovery and Association of Pathogenic Cardiac Rare Variants
Introduction
The primary tool for analyzing genetic data is a linear regression. While the regression may be in many different forms, fundamentally what is happening is a comparison of a genetic-type vector against some outcome or phenotype. This process is flexible and powerful, however begins to break down when the genetic-type vector is skewed to one class. Or in other words, the vast majority of individuals have one type of genetic identity (at that variant) while a small group of individuals have another type of genetic identity. While there is a good mathematical explanation to back this up, the underlying reason we have difficulty analyzing this skewed dataset is that it represents a small sample size. The few people with the rare variant could have a disease because of the variant, or perhaps their disease status is just random chance - with a small sample size it is difficult to determine which is true.
A single rare variant can impart a relatively huge impact on a relativey tiny number of individuals. Therefore, we cannot give up on identifying whether a rare variant does impact or lead to disease just because regression does not work. Rather we need to develop other tools. In this research pursuit two general types of identification methods have been developed. The first simply looks at case reports from clinical settings. This slightly old fashioned approach can be though of as a collection of anecdotes for a given variant which, when viewed together, can be used to suggest that a variant does have some true, causal relationship to a disease. For example, if ten doctors and ten different hospitals all stumble upon ten patients who have an odd cardiac condition and the same super rare genetic variant then we can conclude that super rare genetic variant is likely doing something important. These reports or anecdotes are collected within a resource called ClinVar. The second approach employs sophisticated algorithms which try to predict how the rare variant affects downstream biology. Namely, does the rare variant cause a proten to be misfolded and disfunctional. Many different algorithms exist, each of which report a different severity or pathogenicity score.
With many methods available to determine whether a rare variant is pathogenic, it may seem impossible to come up with a single, clear methedology. Fortunately, many very bright individuals have developed just such a methedology. The American College of Medical Genetics (ACMG) provide a flowchart with detailed accompanying descriptions that help one classify a variant as being either pathogenic or non-pathogenic. The only problem
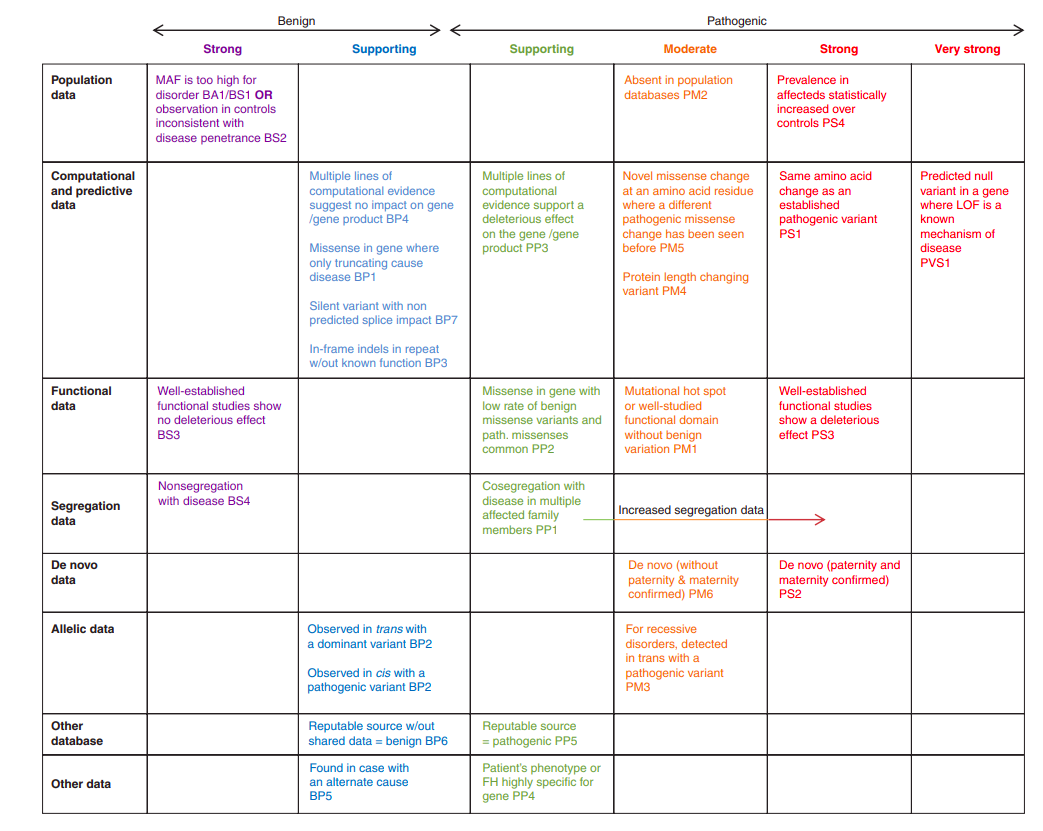
Unfortunately for my purposes, this flow chart requires a great deal of labor (multiple hours) just to classify a single variant as pathogenic. While resources are being developed that alleviate this load, for example ClinGen, they are not yet at the point to help me out. Therefore, for this project I defined a variant as being pathogenic if it met all three conditions (then I went on to see if these pathogenic variants associate to adverse cardiac conditions).
Methods
To begin, I defined pathogenicity from the three following conditions.
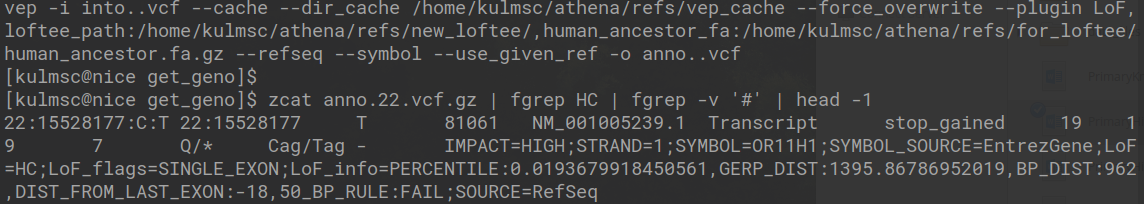
- High Confidence Pathogenic According to LOFTEE - Ensembl has released a piece of software entitled Variant Effect Predictor (VEP), which does exactly what it sounds like. Although, VEP does not report a simple binary rating of patogenicity, which is likely why a recent add-on was created called LOFTEE which attempts to report whether a variant can be classified with high confidence a loss of function variant. The code to run the loftee command and the text of the generated VCF is depicted in the image below. In short, the LoF estimation is HC, which means that on that site of the genome there is high confidence the alternative allele causes some loss of function.
- Listed as Pathogenic or Likely Pathogenic Within ClinVar - As stated previously, and within ClinVar itself, ClinVar “processes submissions reporting variants found in patient samples, assertions made regarding their clinical significance, information about the submitter, and other supporting data.” Specific to our own purposes, ClinVar organizes the submissions into notes linked to a variant that are organized and can be downloaded in a VCF format. The VCF is depicted below, and can easily be searched to find variants that are either pathogenic or likely pathogenic.

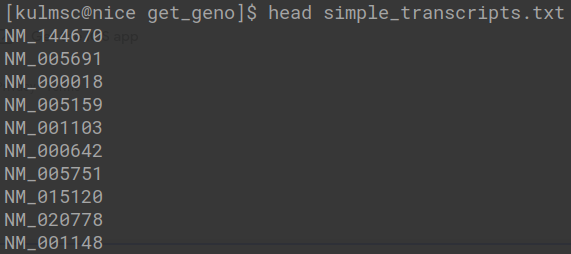
- Located on a Gene That Invitae Uses in Their Cardiac Panel - Invitae is a private, well-respected company that creates clinical-grade reports on a patient’s genetics. We figured that they have a good sense of what genes potentially influence adverse cardiac conditions. The genes we specifically used came from the Invitae Arrhythmia and Cardiomyopathy Comprehensive Panel. Although, an important caveat is that we cannot just look at genes, as different gene transcripts have different levels of severity. Therefore, we are far better specifying a pathogenic transcript as compared to a more general gene, which is exactly what is done, a sample of which is described below.
This is a good place to note that the scripts which actually generate and utilize the data can be found on my GitHub. At the end of the process we have 306 rare pathogenic variants. For each of these variants we then go and pull out the allele identities for all possible individuals in the UK Biobank, creating a large matrix with rows of individuals (about 200,000) and columns of pathogenic variants (306). We lastly combine the genetic matrix with a phenotypic matrix, and actually check to see if what we think are pathogenic variants actually have a pathogenic-type impact on a population.
Results
The rare pathogenic variants identified are hypothesized to associate with the existence of adverse cardiac conditions. For simplicity, we will look at only one cardiac condition that is relatively common (and therefore has good statistical power), atrial fibrillation. We identify each of individual as either having atrial fibrillation or not by their electronic health records, which come in the form of ICD-10 codes. We therefore have both a matrix of rare, pathogenic genotypes and a vector of phenotypes. If we were conducting a genome-wide association study we would iterate through each column of our matrix and regress it against the phenotype vector. As stated earlier (in the introduction) we probably should not do this because the variants are so rare that the regression is under-powered. We can work around this problem by combining rare variants together according to the gene they fall within. For example, the first five rare variants identified might all fall into the ABC gene. We can therefore sum these five variants together into a single ABC pathogenic gene vector and regress it against the phenotype. This is the exact process we completed, except that the regression we completed was specifically a logistic regression adjusted for many important risk factors, such as age, sex, and BMI. The strength of the associations are depicted below.
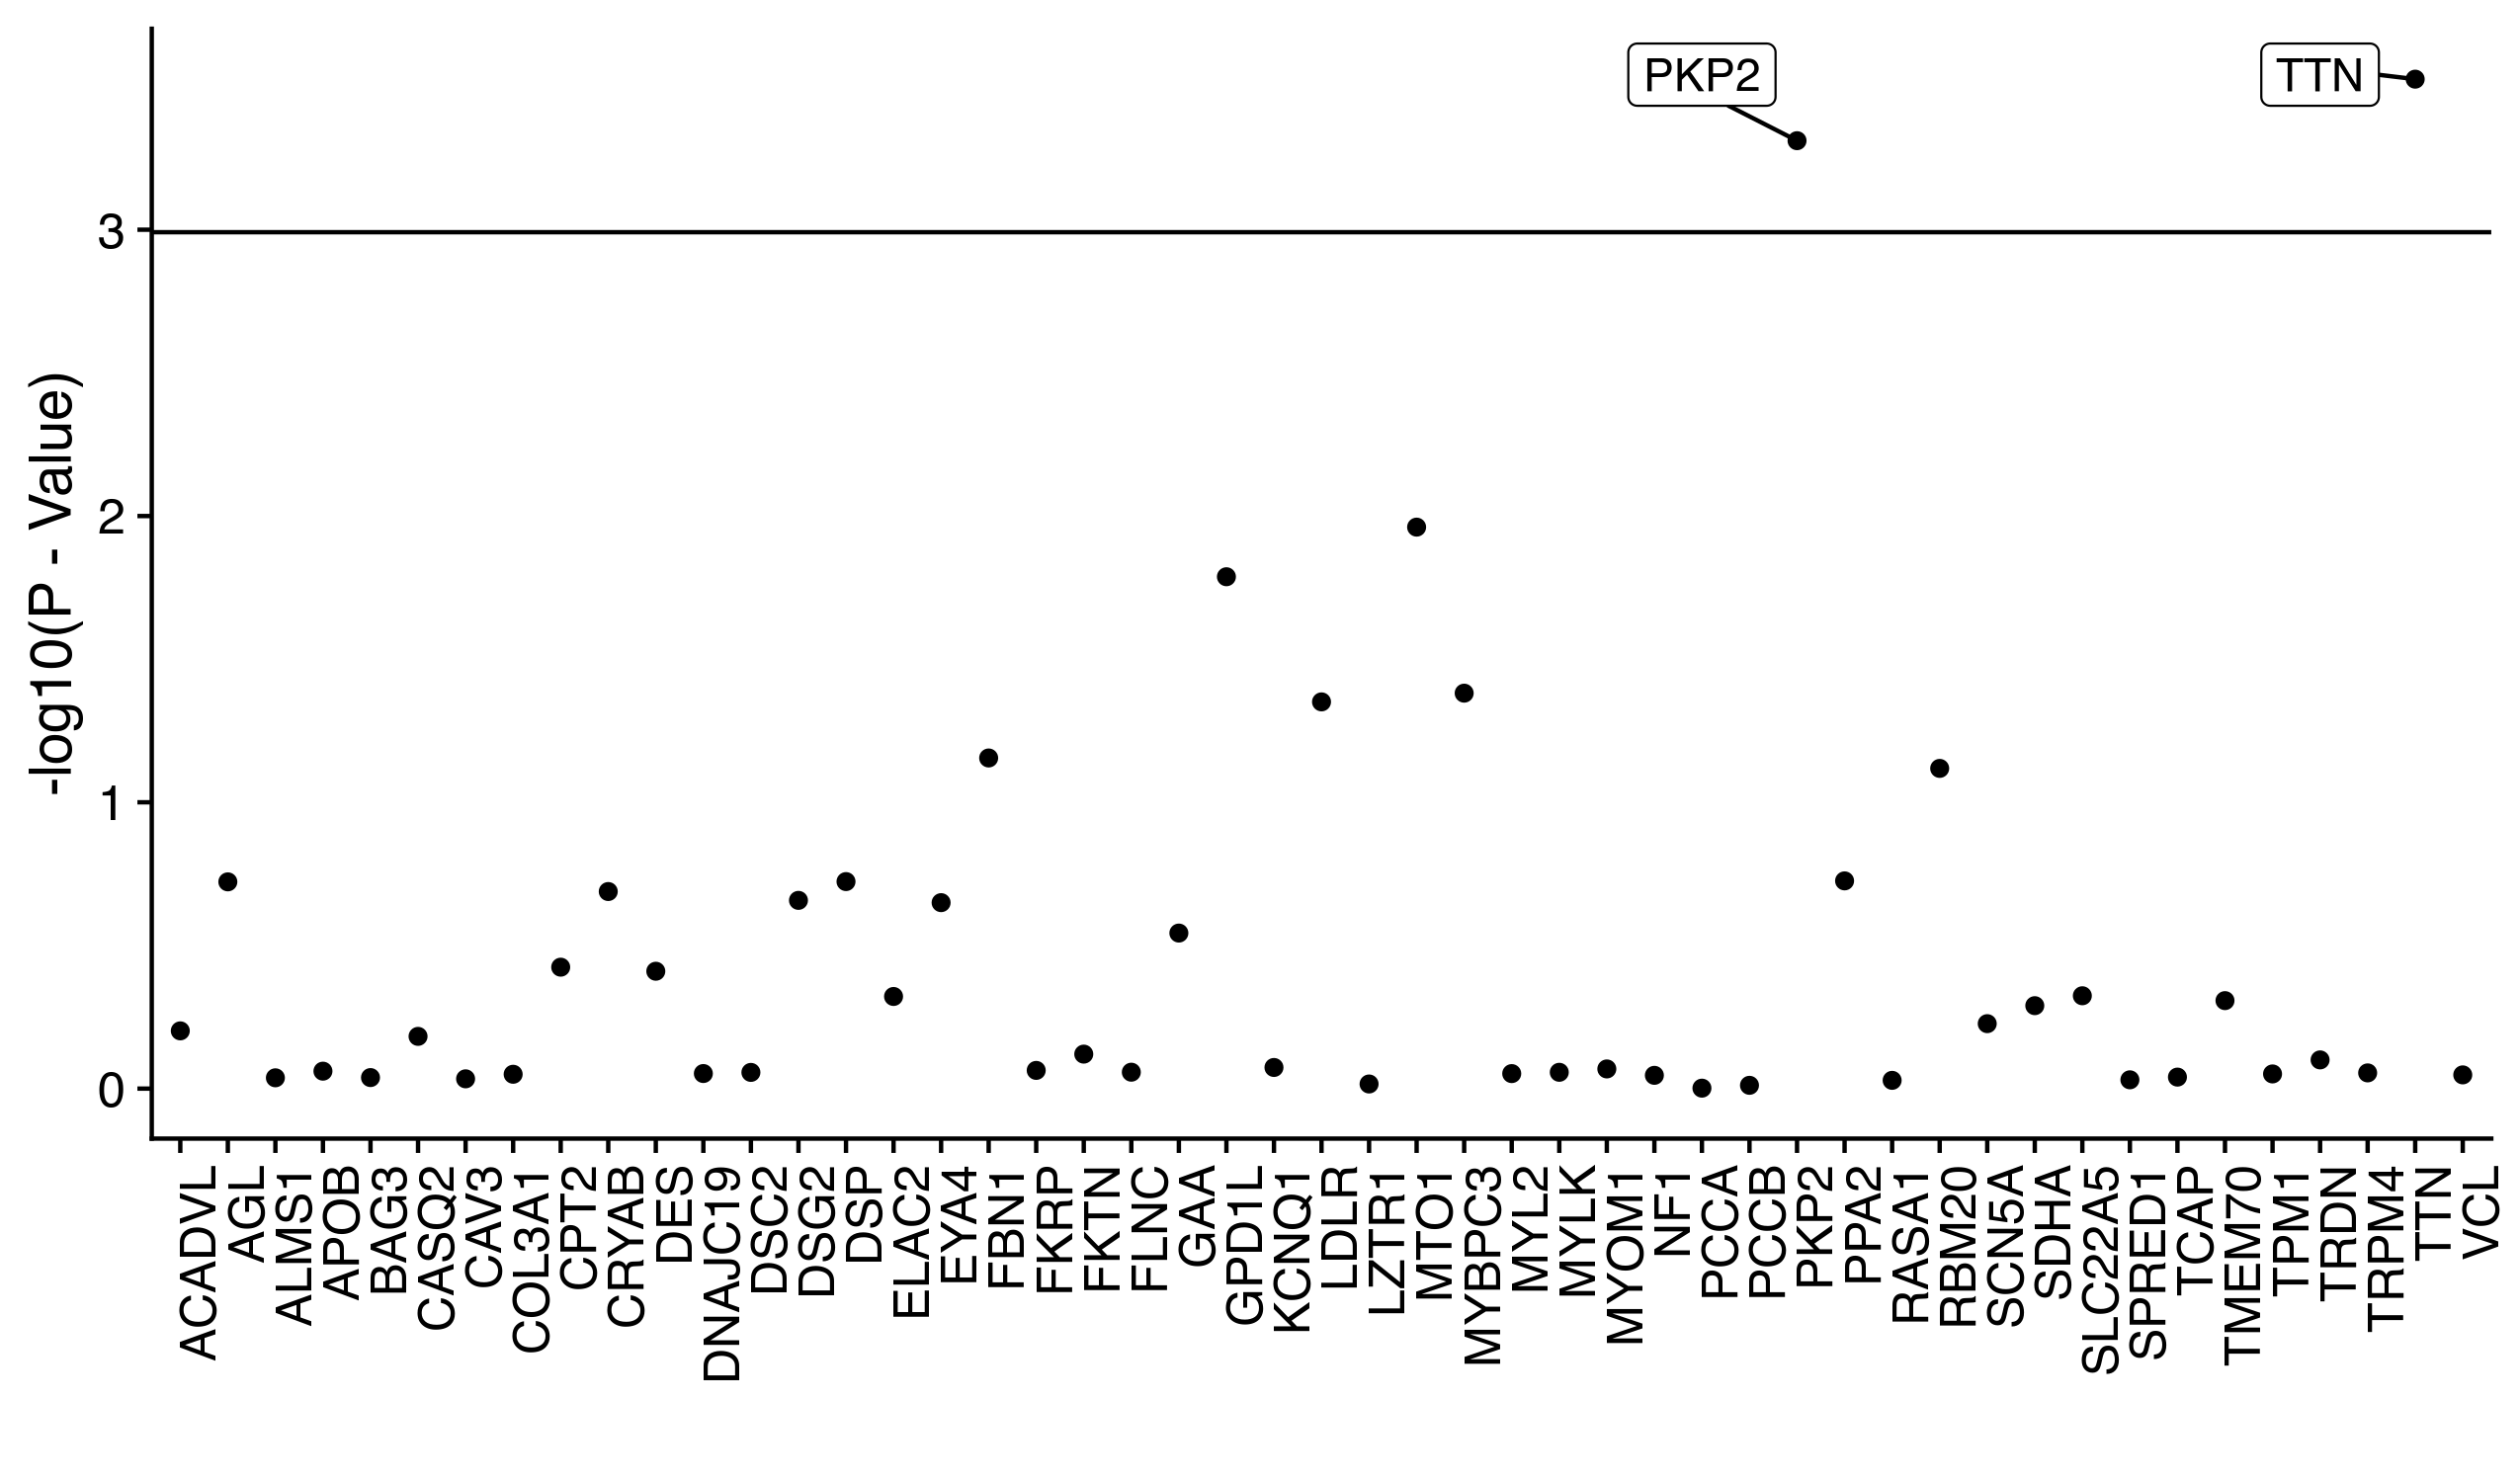
We can directly see that while the pathogenic vectors of most genes fall under the Bonferonni signficance threshold (the horizontal line), two genes do surpass the threshold: TTN and PKP2. Both of these genes are often mentioned in research articles of cardiac genetics, which makes these findings strong replications of prior results.
While this initial result suggests that we have picked out a few truly pathogenic cardiac variants, it also suggests many of the variants we thought were pathogenic may in fact not be. Although, the lack of a strong sample size prevents us from saying anything too definitive. To try and workaround this sample size issue (once again) we combine all of the pathogenic variants together into a single binary pathogenic variable or vector. Within this vector an individual can either be linked to a one if they possess any pathogenic variant (across all possible 306) or a zero if they do not possess any pathogenic variant. When we look at the rates of atrial fibrillation across the binary pathogenic status we see signficantly greater disease in those who are positive (P < 0.001).
While a nice result, we can go a step further and up the sophistication of our analysis by integrating in many possibly confoudning variables (age, sex, BMI, alcohol, smoking, health history, etc.) and look at the age of onset of atrial fibrillation rather than the simple binary disease status. This type of analysis is possible with a cox proportional hazard model, which just like a logistic regression model can be multivariate, or consider multiple covariates, and through its survival framework can track the time of each individual until disease or censorship (lost to follow-up). Unfortunately, this idea was considered a little too complex for my collaborators, so we scrapped the adjustment idea and just went with a Kaplan Meier Curve which tracks the rate of survival of groups over time (just as simple as it seems). The code we used to do is as follows:
#create a survdiff object, which tests the difference between two survival curves
#in this case the two curves are defined by the pathogenic vector status
diff <- survdiff(Surv(time_to, primary_pheno) ~ binary_lpv, data = df)
pval <- pchisq(diff$chisq, length(diff$n)-1, lower.tail = FALSE)

#we follow a very similar process to actually compute the KM curve
#the problem is that the output of the survfit function stacks up the survival rates across the two pathogenic groups
surv_dat <- survfit(Surv(time_to, primary_pheno) ~ binary_lpv, data = df)

#so what we have to do is find the point where the survfit data is stacked
#then we split the stack to create a nice, neat dataframe which can be plotted
plot_df <- data.frame("time" =  surv_dat$time, "value" = 1 - surv_dat$surv,
                      "variable" = "-", "se" = surv_dat$std.err, stringsAsFactors = F)
split_point <- which(surv_dat$time - c(surv_dat$time[2:length(surv_dat$time)], 100000) > 0)
plot_df$variable[(split_point + 1):nrow(plot_df)] <- "+"

#the plot is made here, specifically with ggplot
the_plot <- ggplot(plot_df, aes(time/365, value *100, color = variable)) + geom_line(size = 2) +
  labs(x = "Time From Enrollment, years", y = paste0("Cumulative Population with ", caplabel, ", %"),
       caption = paste0("P = ", signif(pval, 4)), color = "LPV\nStatus")
plot(the_plot)
The resulting plot actually looks like:
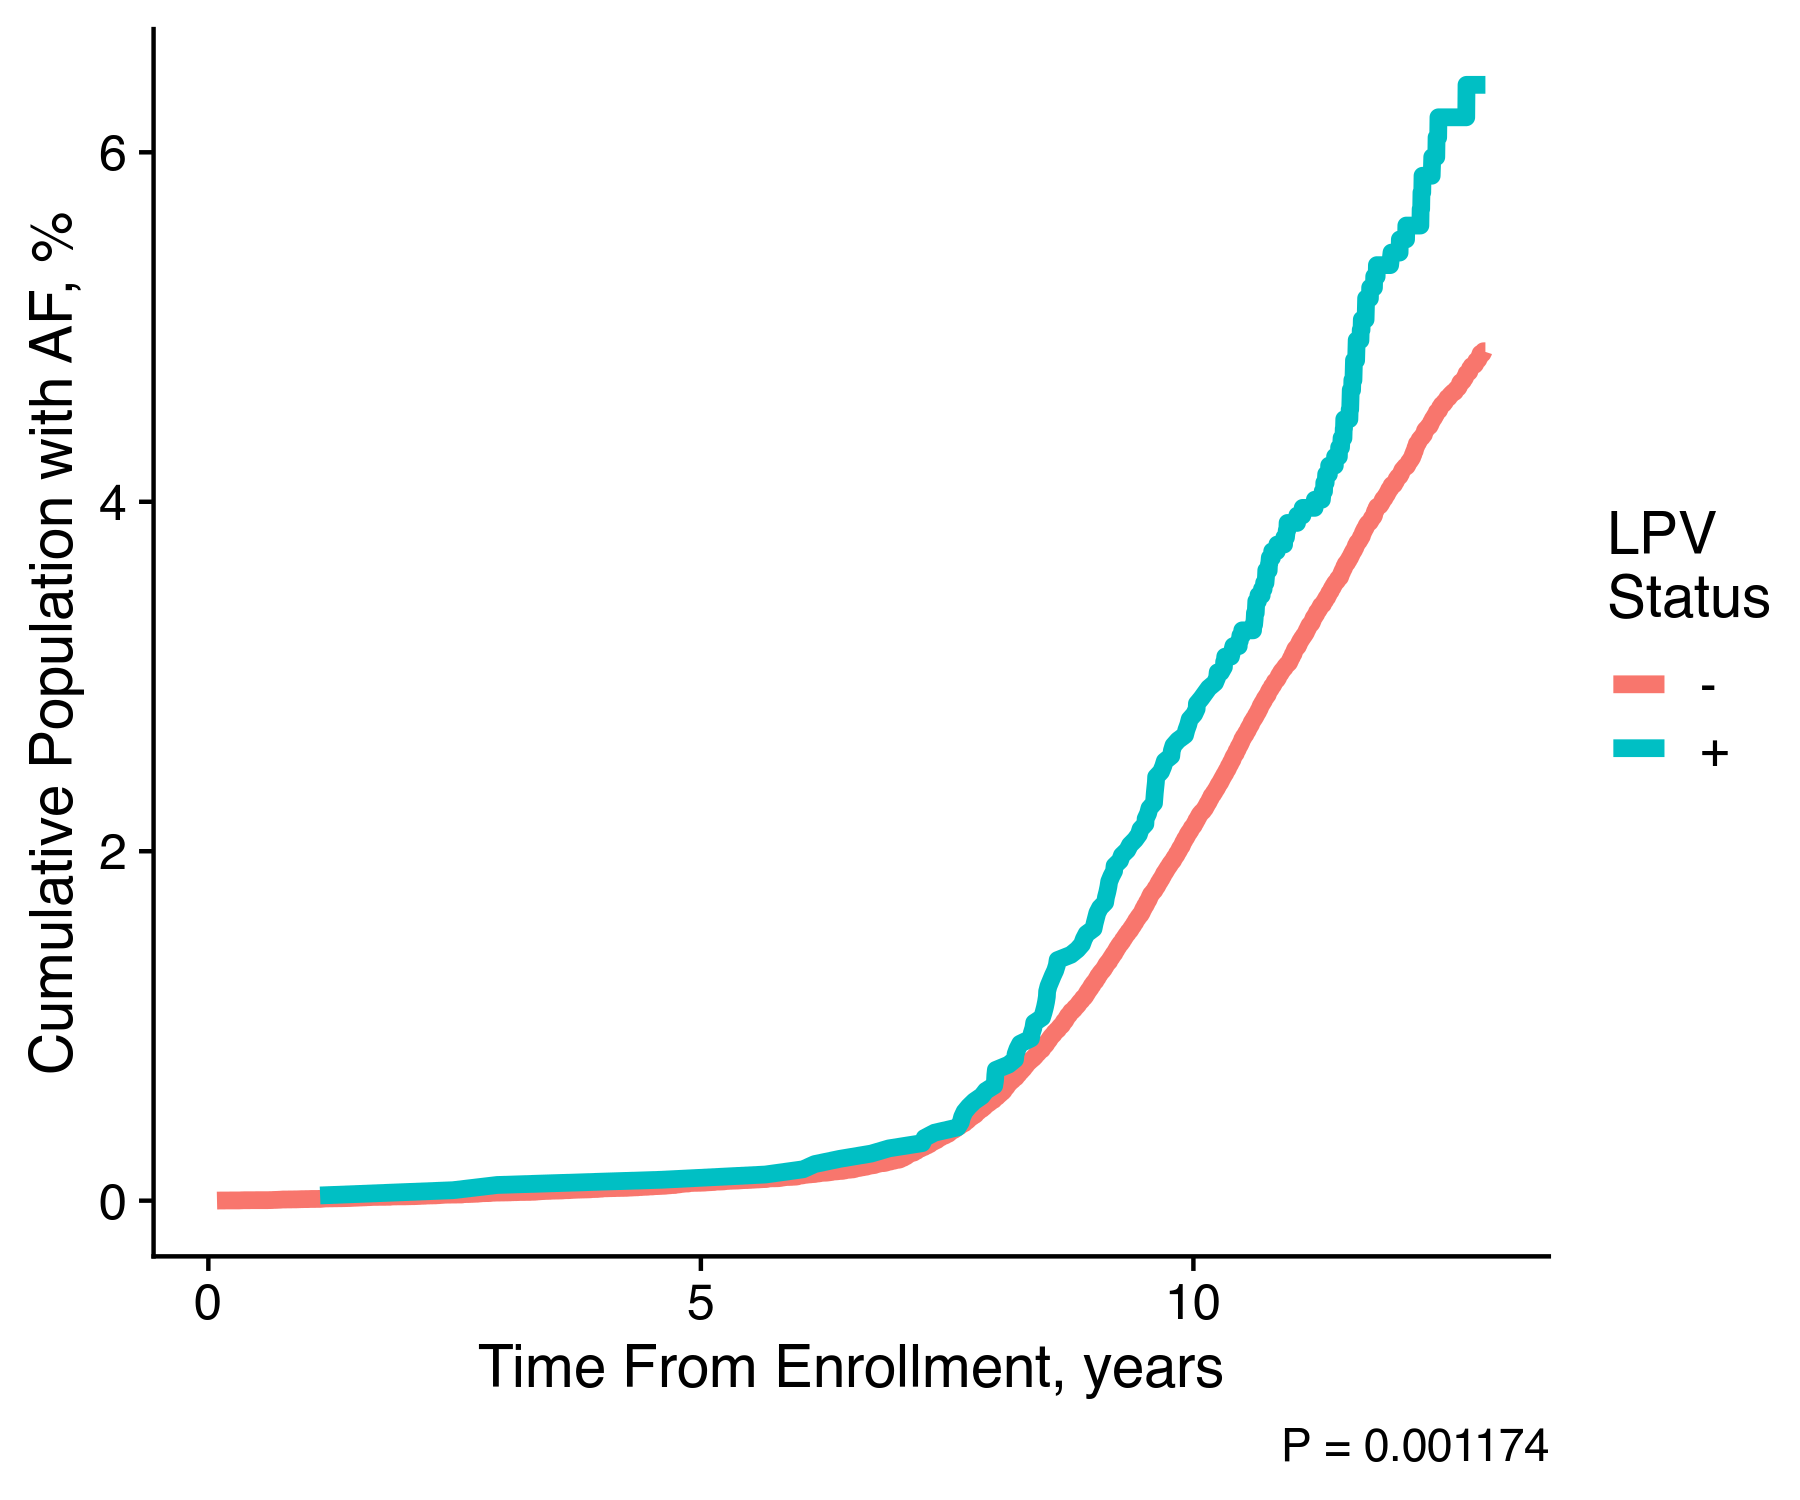
We can clearly see that individuals who hold one of the pathogenic variants are significantly more likely to experience atrial fibrillation as compared to individuals without any pathogenic variants. With this single image our hypothesis is almost confirmed. We clearly could continue our work to provide for the proper adjustment within the survival analysis, and we could even go further to work on other cardiac conditions.
Without further work this result is still noteworthy as it provides clear evidence for how understanding an individual’s genetics can lead to improved individual assessment, and under a precision medicine paradigm, improved clinical outcomes. Moreover, very similar variants likely exist for other diseases. Some of these variants may have a very specific clinical presentation which may create clear oppurtunities for treatment improvements. While some of this is obviously speculation, I hope the kernel is there, showing how this type of project is a template for future advancements.